
By Julie BUTCHER
It is not unusual to hear regular complaints by callers into the weekly Glendale City Council meetings criticizing the pay and benefits paid to city workers. One regular caller is known to rant about the outrageous salary paid to the city manager, never missing a chance to point out the burgeoning pension obligation the city owes CalPERS for the city’s public safety and other workers.
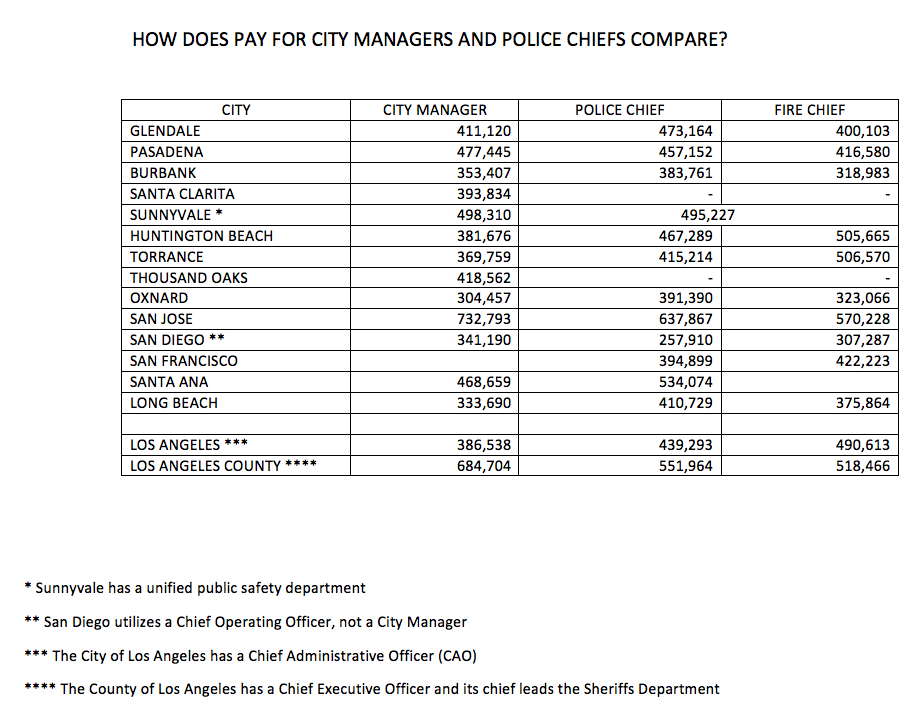
How do Glendale’s wages and benefits – and the cost of providing municipal services – compare to other cities?
The CV Weekly analyzed the wages and benefits paid by various California cities to find the answers.
Movoto real estate rated Glendale No. 1 atop a list of the 10 safest mid-sized cities in the U.S. Seven of the 10 are in California, six in Southern California. Following Glendale is Santa Clarita, Sunnyvale, Naperville, Illinois, Cary, North Carolina, Thousand Oaks, Oxnard, Aurora, Illinois, Huntington Beach and Torrance.
For comparison purposes, the cities of Pasadena and Burbank are included as neighboring cities, as is the city of Los Angeles and the County of Los Angeles. Other relevant California cities are included in this analysis.
In May, Fitch Ratings reissued AA rating for Glendale, noting “the city’s strong revenue growth prospects, moderate long-term liability burden, solid expenditure flexibility, and consistently strong reserves relative to expected revenue volatility and budget flexibility” to justify the strong financial rank.”
“Fitch believes the city is in a strong position to manage risks associated with the current downturn. The city’s reserves at the end of fiscal 2019 were approximately $96 million, or 42% of general expenditures,” stated the website. “There are currently no external borrowing plans by the city and internal borrowing is possible with 400 days cash on hand is available to temporarily cover any short-term cash borrowing needs. Fitch assumes the city has sufficient capacity to rebalance spending to offset the current weak revenue environment given its robust reserves, ability to negotiate with labor, strong control of the labor environment, and track record of downsizing. The city’s ability to absorb the shock and maintain financial resilience will be tested by the depth and duration of the recession.”
The city’s budget documents are posted on its website: https://www.glendaleca.gov/government/departments/finance/budget. There is a link to past budget documents there as well.
On average, nearly half of California’s municipal budgets go to paying for workers and the accompanying costs of those employees. At the state level, more than half of the state’s budget is allocated to paying for personnel.
The conservative California Policy Center offered this profile of the state’s public worker pay: “In California, during 2012 the average miscellaneous full-time employee collected total compensation as follows: Cities, $111K; Counties, $98K; State, $90K. Also during 2012, the average full-time public safety employee collected total compensation of: Cities, $170K, Counties, $140K; State, $129K. Add at least 12% to these numbers to reflect unfunded retirement health care and pension obligations, and you have an accurate representation of what California’s public servants earn, built from the ground up using the actual payroll records.”
In 2018, 482 California cities employed 333,874 workers, paying them $23 billion in wages and $7 billion in benefits and retirement expenses – for an average statewide wage of $69,736, or $90,902 in total compensation.
What does it mean to be a “full service” city?
The City of Glendale defines a full-service city as one that is “capable of funding and providing a complete array of in-house public services to residents without contracting out with third-party agencies. Glendale owns and operates its own police, fire, parks, libraries, sewer service, trash collection, street maintenance, and traffic management. Glendale residents benefit from the enhanced cross-departmental communication and better overall quality of service.”
But is it possible to fairly compare private and public sector jobs?
The Hoover Institution offers a critical explanation of the differences between public and private sector workers in its article “At $140,000 Per Year, Why Are Government Workers In California Paid Twice As Much As Private Sector Workers?” found at Hoover.org.
Government workers in every one of the jurisdictions included are represented by a union. Glendale has memoranda of understanding (MOUs) covering five distinct bargaining units including managers up to department heads and sworn managers in the police and fire departments.
All of Glendale’s contracts (MOUs are also called collective bargaining agreements or contracts and have the same binding legal impact) are posted on its website. In California, an employer is obligated to bargain over changes in wages, hours and all terms and conditions of employment.
In California, public employees do not pay into Social Security and are penalized at retirement by the obscurities of the government pension offset, enacted in 1977, and the windfall elimination provision, enacted in 1983, known as GPO/WEP for short.
All of the full-time public service workers considered in this analysis receive comprehensive health benefits and are covered by a defined-benefit retirement plan.
Investopedia explains the difference between this type of plan and the now more common defined contribution plan: “Employer-sponsored retirement plans are divided into two major categories: defined-benefit plans and defined-contribution plans. As the names imply, a defined-benefit plan – also commonly known as a traditional pension plan – provides a specified payment amount in retirement. A defined-contribution plan allows employees and employers (if they choose) to contribute and invest funds over time to save for retirement.
“These key differences determine which party – the employer or employee – bears the investment risks and affects the cost of administration for each plan.”
To see charts that detail this information, visit www.cvweekly.com/NEWS.
HOW DO CITIES COMPARE?
| CITY | POPULATION | # CITY EMPLOYEES | F/T YEAR-ROUND | FIRE? | POLICE? | MEDIAN PAY | INCL BENEFITS | TOTAL CITY EMPLOYEE COMPENSATION | PRVATE SECTOR MEDIAN WAGE |
| GLENDALE | 200,372 | 2180 | 1376 | X | X | 93,891 | 126,302 | 217,574,016 | 53,952 |
| PASADENA | 141,246 | 2486 | 1543 | X | X | 93,124 | 134,004 | 262,696,080 | 56,315 |
| BURBANK | 104,765 | 980 | 842 | X | X | 108,405 | 149,201 | 174,805,291 | 57,094 |
| SANTA CLARITA | 209,478 | 1248 | 318 | 83,244 | 100,734 | 47,765,278 | 60,923 | ||
| SUNNYVALE | 152,323 | 1503 | 908 | X | X | 92,658 | 138,695 | 157,454,131 | 104,470 |
| HUNTINGTON BEACH | 200,606 | 1682 | 650 | X | X | 124,077 | 176,002 | 173,321,103 | 65,367 |
| TORRANCE | 146,392 | 2146 | 1119 | X | X | 85,537 | 109,155 | 180,458,124 | 71,467 |
| THOUSAND OAKS | 128,481 | 595 | 331 | 82,659 | 109,653 | 45,164,715 | 79,043 | ||
| OXNARD | 207,568 | 2058 | 1042 | X | X | 80,253 | 106,431 | 142,588,158 | 34,680 |
| SAN JOSE | 1,026,658 | 8249 | 5691 | X | X | 98,335 | 170,574 | 1,108,677,913 | 65,475 |
| SAN DIEGO | 1,401,932 | 12,613 | 7925 | X | X | 75,705 | 90,844 | 1,285,181,914 | 53,754 |
| SAN FRANCISCO | 883,869 | 40,951 | X | X | 90,073 | 143,336 | 4,779,179,681 | 85,754 | |
| SANTA ANA | 333,499 | 1718 | 924 | X | 109,523 | 159,788 | 178,646,533 | 30,872 | |
| LONG BEACH | 468,883 | 6505 | 4091 | X | X | 90,326 | 124,732 | 631,037,683 | 42,379 |
| LOS ANGELES | 3,959,657 | 50,947 | 34,742 | X | X | 107,450 | 154,585 | 5,980,135,732 | 41,149 |
| LOS ANGELES COUNTY | 10,098,052 | 114,046 | 96,734 | X | X | 78,671 | 109,144 | 12,594,347,587 | 42,094 |
2018 data
Sources:
Transparent California https://transparentcalifornia.com/
California State Controller https://publicpay.ca.gov/
TOTAL EMPLOYEE COSTS PER RESIDENT
| CITY | TOTAL CITY EMPLOYEE COMPENSATION COST PER RESIDENT |
| GLENDALE | 1085 |
| PASADENA | 1859 |
| BURBANK | 1550 |
| SANTA CLARITA | 228 |
| SUNNYVALE | 1033 |
| HUNTINGTON BEACH | 863 |
| TORRANCE | 1232 |
| THOUSAND OAKS | 351 |
| OXNARD | 686 |
| SAN JOSE | 1079 |
| SAN DIEGO | 916 |
| SANTA ANA | 535 |
| LONG BEACH | 1345 |
| LOS ANGELES CITY | 1510 |
| LOS ANGELES COUNTY | 1247 |
| SAN FRANCISCO COUNTY | 5,518 |
City Stands Up to Scrutiny added by CV Weekly on
View all posts by CV Weekly →